
What is the DSP Optimal Ad Frecuency ?
A DSP Optimal Ad Frequency report is a type of report generated by a Demand-Side Platform (DSP) that provides insights into the optimal frequency at which to display ads to a specific target audience. The report is based on data collected from the DSP’s ad campaigns and analyzes the number of times an ad was shown to a specific user and the resulting user behavior, such as clicks or conversions.
The DSP Optimal Ad Frequency report helps advertisers to determine the ideal frequency at which to display ads to a particular audience without overwhelming or annoying them. Showing an ad too frequently can lead to ad fatigue and reduce the effectiveness of the campaign. Conversely, showing an ad too infrequently may not result in the desired level of engagement.
DSP Optimal Ad Frequency Reporting is a tool within Amazon Marketing Cloud that analyzes the optimal frequency at which ads should be shown to customers to maximize engagement and minimize annoyance.
The tool uses data from Amazon’s advertising ecosystem to determine the ideal number of times an ad should be shown to a customer before they lose interest or become irritated.
Benefits for brands include:
- Improved engagement with ads by showing them the optimal number of times to customers.
- Reduction in ad fatigue and annoyance, resulting in a better user experience for customers.
- Improved ROI by reducing ad spend on customers who have seen the ad too many times and are unlikely to convert.
- Increased conversion rates by delivering the right message to the right customer at the right frequency.
- Ability to optimize ad frequency across different channels within Amazon’s advertising ecosystem, including Amazon DSP, Sponsored Products, Sponsored Brands, and Sponsored Display.
- Real-time reporting allows brands to make informed decisions about their ad frequency strategy and make adjustments as needed.
- The tool provides insights into customer behavior and preferences, allowing brands to tailor their messaging and targeting strategies for maximum effectiveness.
Purpose of the report
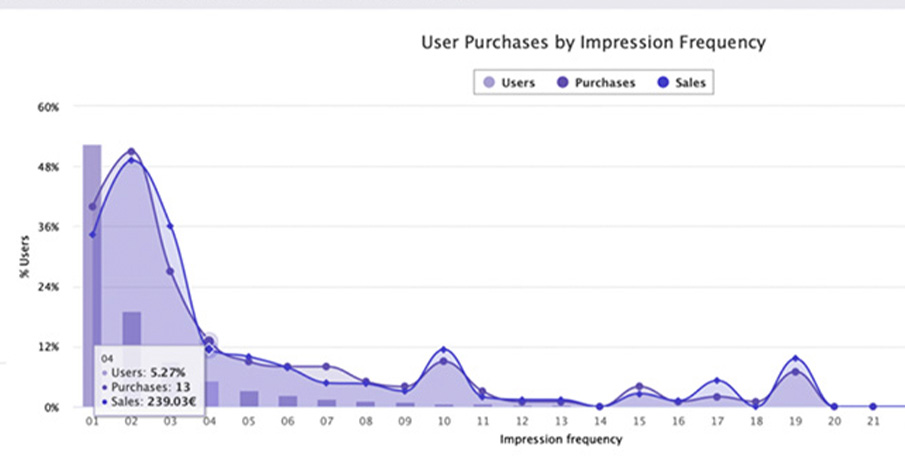
This report is an example of measuring optimal impression frequency for DSP campaigns by various conversion metrics, such as purchases, units sold, product sales, add-to-cart, and detail page views (DPV). The report helps answer questions such as: What is the optimal frequency cap I should apply to my campaigns based on my KPIs? What percentage of my impressions are delivered to users in each frequency bin? Would increasing my frequency translate to increased performance
Insights
Diminishing return point: In most cases, as frequency increases, KPI increases. Then you will see a flatten point. You may interpret that the flatten point represents the optimal ad frequency point and you should apply a frequency cap to the DSP campaign to not waste impressions that return little. This example shows that that campaign is effective up until 11th impression, other campaigns may have flatten points much earlier and would benefit from a lower frequency cap.
Underexposure: On the flip side, when the majority of unique users only see the campaigns of up to two occasions, a large portion of the users are being ‘underexposed.’ This means there is an opportunity to increase reach and exposure via different strategies such as the adoption of new ad product, adjustment of frequency capping, etc.